Key Financial Trends: Member Banks
By Wei Zhang, Senior Analyst, Director, Member Financial Services
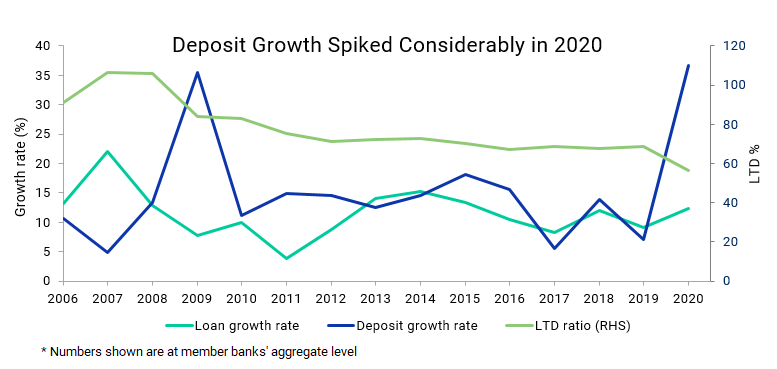
 This past year was a dramatic, if not traumatic, year for the economy and for the banking industry. One of the key lasting features of 2020 was the surge in deposits. While lending activity slowed, a flood of deposits overwhelmed the banking industry’s capacity to profitably deploy the funds. With significantly reduced returns available on reinvestment of funds in loans or investments, we have seen a fall in margins for both individual members and for our cooperative.
As member banks channeled excess funds to pay down liabilities, particularly FHLBank San Francisco advances, our advance balance declined by $35 billion, from $65 billion to $30 billion, over the course of 2020. To provide some historical context for current conditions and explore what may come next, we reviewed the financial ratios of our member banks all the way back to 2006.
Loan-to-Deposit Ratios
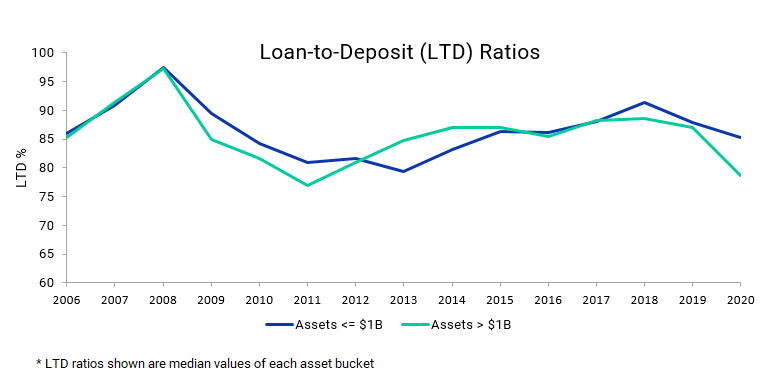
In aggregate, the strong deposit growth enjoyed by members in 2020 far outpaced corresponding loan growth, resulting in a starkly low Loan-to-Deposit (LTD) ratio of 57 percent. This measure was last seen at this level in 2008, during the great financial crisis.
By separating member banks into two groups, one with total assets less than $1 billion and the other with total assets above, we see that our larger members experienced a more severe drop in their collective LTD ratio in 2020 than did the smaller members. This is the greatest such differential in the period under review. The larger banks, with a broader client base that includes corporations, had more deposit inflow, and their deployment of cash, if any, was more heavily directed toward investment securities than loans.
Net Interest Margins
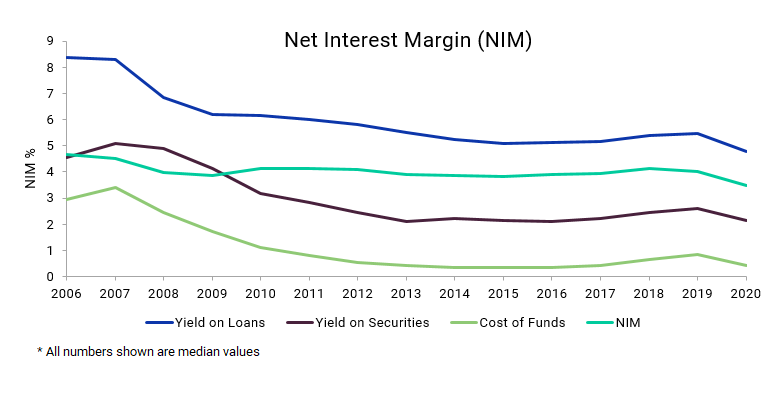
Pressure on Net Interest Margin (NIM) at member banks intensified further in 2020, after peaking around 2018. The NIM for member banks fell from 4.1 percent to 3.5 percent between 2018 and 2020.
A theme of 2019 was that of rapidly rising deposit costs as fears of a scarcity of retail deposits gripped the industry. Liability costs outpaced loan and investment yields, driving NIM lower. Fast forward to 2020, and the Fed is adopting a monetary easing policy to combat the economic shocks of an unprecedented global pandemic. The story for our member banks became one of a glut of deposits, combined with a shortage of investable assets. Further compounding NIM pressure was a precipitous drop of loan and investment yields, which more than offset any benefit to be gained from lower deposit costs.
If it continues, the extreme low interest rate environment will, in the aggregate, put strong pressure on the earnings of our member banks. Individual member experiences may differ based on their specific deposit base profiles. Some members will see relatively expensive deposits mature. Remember the many “specials” that were issued in 2019 and later at rates between 2 percent and 3 percent? Those high-cost funds are now maturing in an environment of much lower rates.
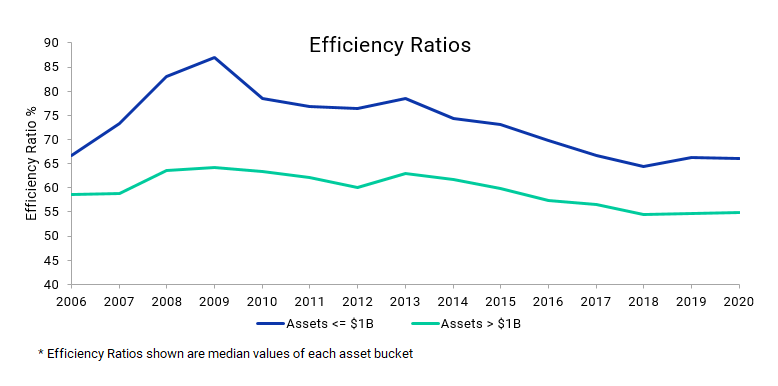
Efficiency
With revenue-generating opportunities under pressure, efficiency improvement usually becomes a focus for management. However, long-standing trends in efficiency improvements were paused in the past two years, perhaps as a consequence of new pandemic-related costs. Our larger member banks operate at more favorable levels of efficiency than their smaller counterparts and have led this trend for decades, incrementally and continuously.
The smaller member cohort has reduced the differential over time, with efficiency ratios appearing to converge, but this improvement has ceased, as highlighted in the following chart, and may be going into reverse. Mergers are one solution to efficiency gains. But depressed stock prices have, until recently, undermined M&A activity. Now stock prices are improving, in response to optimism about the course of the pandemic being changed by widespread vaccination, the economic outlook improving, and a steepening of the yield curve.
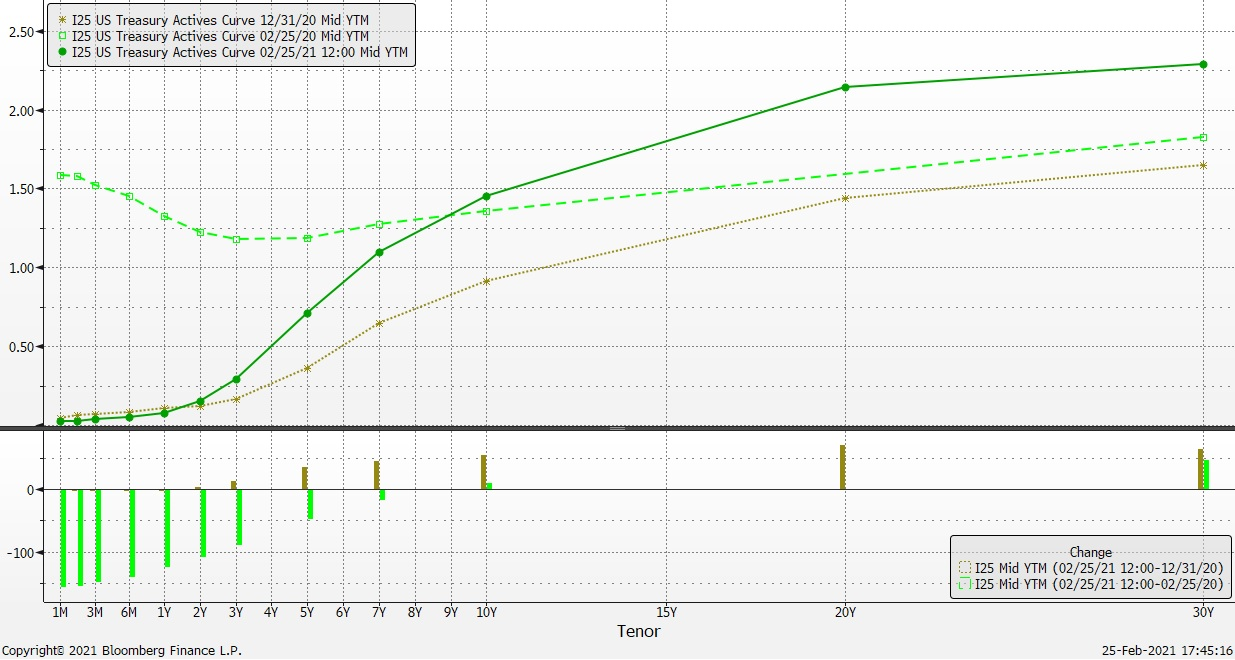
At the time of this writing, additional stimulus initiatives are being proposed by the new Administration, which will likely compound liquidity challenges for members. In addition, the yield curve is steepening rapidly, with shorter-term rates falling and longer-term rates rising. This suggests that the environment may be about to change again, dramatically.
Yield Curve