PPP Impact at a Glance
By Patrick Yu, Member Credit Analyst, Associate Director
Since the launch of the Paycheck Protection Program (PPP) in early April, FHLBank San Francisco member depositories originated 389,550 loans totaling $50 billion, with $1 billion originated by credit unions. The uptake of PPP loans temporarily transformed the balance sheets of many participating member institutions after second quarter 2020, as illustrated in the graph below.
- 137 member banks and 54 credit union members participated in PPP in Q2 2020.
- PPP loans led to significant balance sheet growth and pressured leverage ratios and net interest margins.
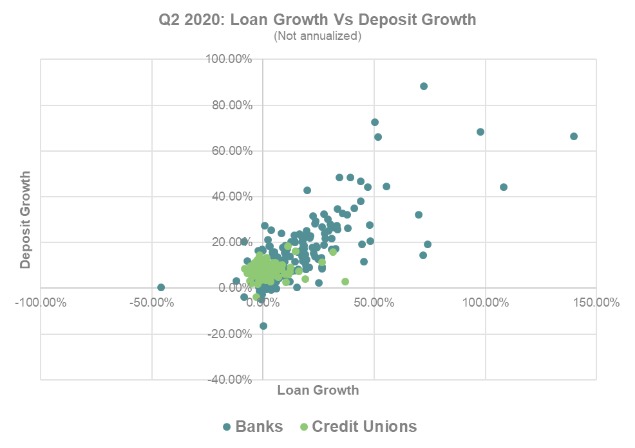
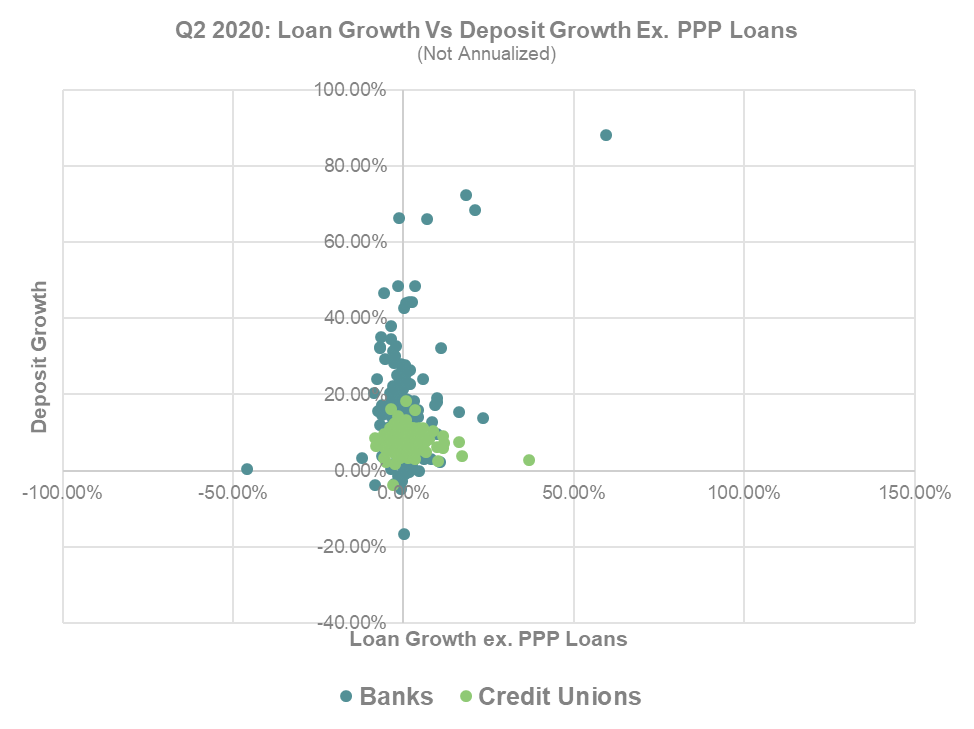
Representing the greatest shock to asset growth in the past ten years, loan growth that included PPP loans far outpaced capital growth and pressured leverage ratios. The median leverage ratio fell from 11 percent to 10 percent for member banks and put particular pressure on members nearing the 9 percent leverage ratio minimum under Community Bank Leverage Ratio rules. Deposit growth increased at a pace similar to loan growth, as commercial deposits from PPP loans were deposited with the originating banking institution. Credit Union members saw a similar, but less pronounced, decline in leverage ratios as consumers cut back spending, which led to higher-than-normal deposit growth. Median loan growth excluding PPP loans was 0 percent for both member banks and credit unions in the second quarter.
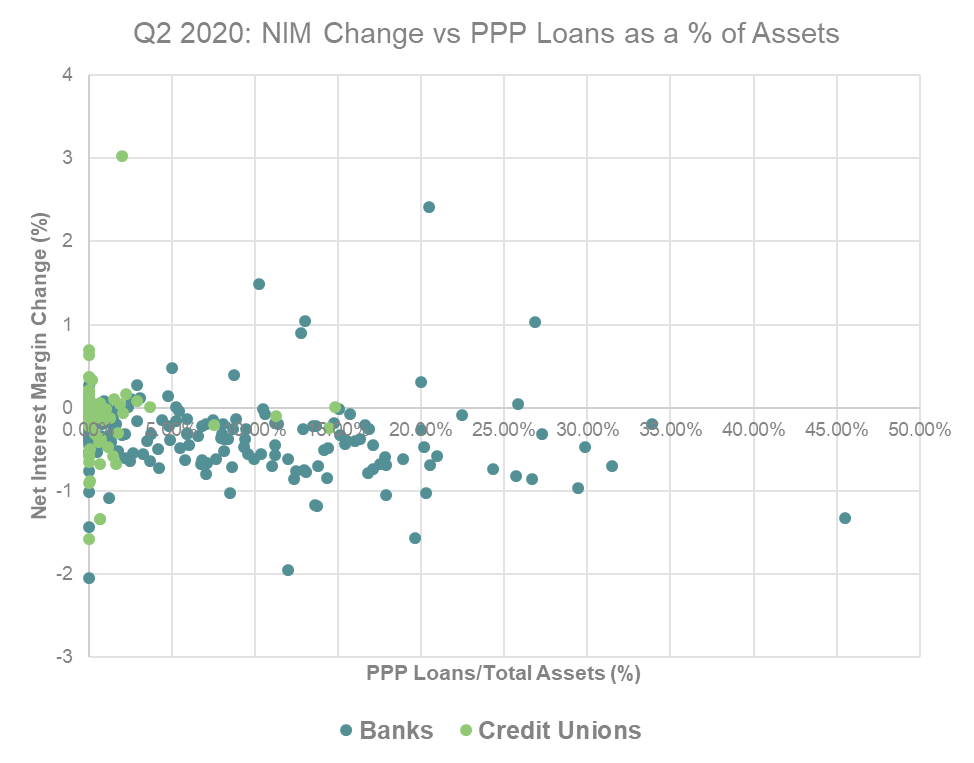
On the profitability side, net interest margins contracted during the quarter on loan yield headwinds and a spike in low-yielding cash balances driven by deposit inflows, partially offset by lower deposit costs. Excess liquidity during the quarter was mostly invested in short duration U.S. Treasuries and Agency debt or held at the Federal Reserve earning 10 basis points (bps). Excess deposits at member credit unions led to a modest median net interest margin decline of 6 bps, to 3.47 percent. Member banks experienced a sharper contraction in their median net interest margin, down 46 bps to 3.33 percent, because higher participation in PPP loans which yield 1 percent.
In Conclusion
Our member banks and credit unions are well positioned going into 2021, but they remain highly sensitive to continued fiscal support and the duration of government shelter-in-place orders. Absent another round of PPP funding, we expect leverage ratios to improve starting in Q4 2020, as PPP loans are forgiven and commercial deposits continue to draw down. Delinquency metrics are likely to see a temporary spike in Q2 2021 after deferral periods end and before SBA guarantees kick in. Profitability will likely remain a pain point as mortgage and commercial loan spreads continue to tighten against U.S. Treasuries, partially offset by recognition of PPP origination fees when loans are forgiven.
November 12, 2020 | FHLBank San Francisco